统计学基础及Excel统计应用(英文版)
定价:¥58.00
作者: 黎明
出版时间:2019-12
出版社:化学工业出版社
- 化学工业出版社
- 9787122353511
- 1版
- 284816
- 60230131-9
- 无线胶订膜
- 16开
- 2019-12
- 355
- 217
- ①C8
- 公共课类
- 本科
作者简介
内容简介
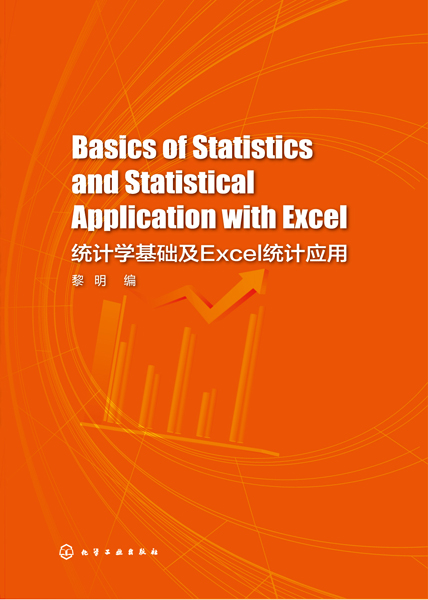
The edition of Basics of Statistics and Statistical Application with Excel emphasizes concepts of statistics,statistical methods are carefully presented with a focus on understanding both the suitability of the method and the meaning of the atistical methods and measurements are developed in the context of e text also introduces the application of statistical knowledge with Excel,which solving practical problems is intended for anyone looking to learn the basics of applying Excel’s powerful statistical tools to their business courses or work activities.
This book clearly and methodically shows and explains how to create and use these statistical tests to solve practical problems in cel is an easily available computer program for students, instructors,and is also an effective teaching and learning tool for quantitative analyses in business courese.
This book clearly and methodically shows and explains how to create and use these statistical tests to solve practical problems in cel is an easily available computer program for students, instructors,and is also an effective teaching and learning tool for quantitative analyses in business courese.
目录
Part Ⅰ Introduction of Basic Statistics1
1.1The Nature of Statistics1
1.1.1What Is Statistics?1
1.1.2Population and sample2
1.1.3Descriptive and Inferential Statistics3
1.1.4Parameters and Statistics4
1.1.5Statistical Data Analysis5
1.2Variables and Organization of the Data5
1.2.1Variables5
1.2.2Organization of the Data7
1.3Describe data by Tables and Graphs7
1.3.1Qualitative Variable7
1.3.2Quantitative Variable9
1.3.3Samples and Population Distributions14
1.4Measures of Center15
1.4.1The Mode15
1.4.2The Median17
1.4.3The Mean18
1.4.4Which Measure to Choose?19
1.5Measures of Variation19
1.5.1Range19
1.5.2Interquartile Range20
1.5.3Standard Deviation22
1.5.4Sample Statistics and Population Parameters24
1.6Probability Distributions and Normal Distributions25
1.6.1Probability Distributions25
1.6.2Mean and Standard Deviation of Random Variables28
1.6.3Normal Distributions29
1.7Sampling Distributions and Sample Means31
1.7.1Sampling Distributions31
1.7.2Sampling Distributions of Sample Means32
1.8Estimation35
1.8.1Point Estimation35
1.8.2Confidence Interval36
1.9Hypothesis Testing39
1.9.1Hypotheses39
1.9.2Significance Test for a Population Mean μ41
1.10Summarization of Bivariate Data44
1.10.1Qualitative Variables44
1.10.2Qualitative Variables and Quantitative Variables48
1.10.3Quantitative Variables52
1.11Scatterplot and Correlation Coefficient53
1.11.1Scatterplot53
1.11.2Correlation Coefficient54
Part Ⅱ Statistical Application with Excel58
2.1Sample Size,Mean,Standard Deviation,and Standard Error of the Mean58
2.1.1Mean58
2.1.2Standard Deviation59
2.1.3Standard Error of the Mean59
2.1.4Sample Size,Mean,Standard Deviation,and Standard Error of the Mean60
2.1.5Saving a Spreadsheet66
2.1.6Printing a Spreadsheet67
2.1.7Formatting Numbers in Currency Format(2 Decimal Places)68
2.1.8Formatting Numbers in Number Format(3 Decimal Places)69
2.1.9End-of-chapter Practice Problems69
2.2Random Number Generator71
2.2.1Creating Frame Numbers for Generating Random Numbers71
2.2.2Creating Random Numbers in an Excel Worksheet73
2.2.3Sorting Frame Numbers into a Random Sequence74
2.2.4Printing an Excel File So That All of the Information Fits onto One Page77
2.2.5End-of-chapter Practice Problems79
2.3Confidence Interval about the Mean by Using the TINV Function and Hypothesis Testing81
2.3.1Confidence Interval about the Mean81
2.3.2Hypothesis Testing90
2.3.3Alternative Ways to Summarize the Result of a Hypothesis Test100
2.3.4End-of-chapter Practice Problems101
2.4One-group t-test for the Mean105
2.4.1The 7 Steps for Hypothesis-testing by Using the One-group t-test105
2.4.2One-group t-test for the Mean109
2.4.3Can You Use Either the 95 Percent Confidence Interval about the Mean or the One-group t-test When Testing Hypothesis?112
2.4.4End-of-chapter Practice Problems113
2.5Two-group t-test of the Difference of the Means for Independent Groups116
2.5.1The 9 Steps for Hypothesis-testing by Using the Two-group t-test117
2.5.2Formula #1: Both Groups Have More Than 30 People in Them123
2.5.3Formula #2:One or Both Groups Have Fewer than 30 People in Them128
2.5.4End-of-chapter Practice Problems132
2.6Correlation and Simple Linear Regression135
2.6.1What Is a “Correlation”?135
2.6.2Using Excel to Compute a Correlation Between Two Variables141
2.6.3Creating a Chart and Drawing the Regression Line onto the Chart143
2.6.4Printing a Spreadsheet So That the Table and Chart Fit onto One Page150
2.6.5Finding the Regression Equation151
2.6.6Adding the Regression Equation to the Chart160
2.6.7How to Recognize Negative Correlations in the Summary Output Table161
2.6.8Printing Only Part of a Spreadsheet Instead of the Entire Spreadsheet162
2.6.9End-of-chapter Practice Problems165
2.7Multiple Correlation and Multiple Regression169
2.7.1Multiple Regression Equation169
2.7.2Finding the Multiple Correlation and the Multiple Regression Equation171
2.7.3Using the Regression Equation to Predict Annual Sales174
2.7.4Using Excel to Create a Correlation Matrix in Multiple Regression175
2.7.5End-of-chapter Practice Problems178
2.8One-way Analysis of Variance(ANOVA)183
2.8.1Using Excel to Perform a One-way Analysis of Variance(ANOVA)185
2.8.2How to Interpret the ANOVA Table Correctly?187
2.8.3Using the Decision Rule for the ANOVA F-test187
2.8.4Testing the Difference Between Two Groups by Using the ANOVA t-test188
2.8.5End-of-chapter Practice Problems193
Appendix199
TABLE 1 Table of Random Numbers199
TABLE 2 The Cumulative Standardized Normal Distribution202
TABLE 3 Critical Values of t205
TABLE 4 Critical Values of χ2208
TABLE 5Critical Values of F209
Reserences217


